Ambari自定义服务启动成功后,依旧显示停止状态的解决方案
1、概述
如果遇到该情况,首先前往 /var/log/ambari-agent/ambari-agent.log 查看日志输出。
服务安装后,每隔大约 60s 会执行 status() 方法。如果执行 status() 方法的过程中报错,则在 Ambari 页面上会显示服务已停止。如果执行 status() 方法的过程中没报错,则在 Ambari 页面上显示服务正常。
通常在 status() 方法中,我们会使用 Ambari 提供的 resource_management 模块里的 check_process_status() 来判断服务的状态。
check_process_status() 通过检测一个 pid 文件里面的进程号,来判断服务的启动状态。通常 pid 文件内只有一个进程号,如 12168 。
2、问题示例分析
2.1、报错
以自定义服务 JanusGraph 为例,status() 方法是这样写的:
1 | from resource_management import * |
graphexp_params.py 文件的局部内容:
1 | from resource_management import * |
上述代码是动态获取 Ambari 页面上的 graphexp_pid_dir 配置项,然后拼凑成一个 pid 文件路径,这个 pid 文件内容只有 graphexp 组件的进程号。
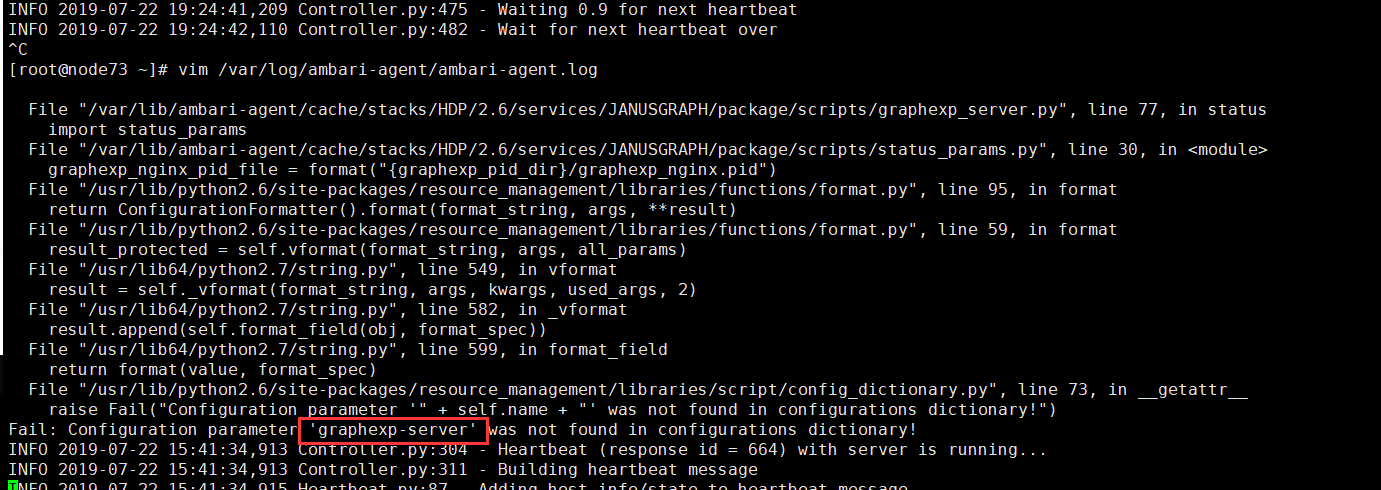
结果出错了,根据 /var/log/ambari-agent/ambari-agent.log 日志输出,发现在 status_params.py 里面获取 graphexp-server.xml 文件内的参数值报错,如下图所示:
2.2、问题排查
在 status() 方法下,输出 config[‘configurations’] 发现只能打印出:
1 | ams-hbase-env,infra-solr-env,hbase-env,ams-env,elastic-env,janusgraph-env,ams-grafana-env,hadoop-env,zookeeper-env,cluster-env |
以上这些值,没有 graphexp-server 项。
而在 start() 方法里面打印有很多,所有的 configurations 的 xml 文件都被加载到了:
1 | ranger-hdfs-audit,ssl-client,infra-solr-log4j,ranger-hdfs-policymgr-ssl,ams-hbase-site,elastic-config,ranger-hbase-audit,hdfs-logsearch-conf,ams-grafana-env,ranger-hdfs-security,ams-ssl-client,infra-solr-env,ranger-hdfs-plugin-properties,hbase-policy,ams-logsearch-conf,ams-hbase-security-site,hdfs-site,ams-env,ams-site,ams-hbase-policy,janusgraph-env,hadoop-metrics2.properties,hadoop-policy,hdfs-log4j,hbase-site,infra-logsearch-conf,ranger-hbase-plugin-properties,ams-grafana-ini,graphexp-server,ams-ssl-server,infra-solr-xml,ams-log4j,ams-hbase-env,core-site,infra-solr-security-json,gremlin-server,janusgraph-hbase-solr,infra-solr-client-log4j,hbase-logsearch-conf,hadoop-env,zookeeper-log4j,hbase-log4j,postgresql,ssl-server,hbase-env,zoo.cfg,elastic-env,ranger-hbase-policymgr-ssl,zookeeper-logsearch-conf,cluster-env,zookeeper-env,ams-hbase-log4j,ranger-hbase-security |
所以猜测在 status() 方法里面,只能识别 xxx-env.xml 里面的配置内容。但是 ambari2.7 的自定义服务没有这个问题,只在 ambari2.6 上出现了。
2.3、解决办法
新建 graphexp-env.xml 文件,将 graphexp_pid_dir 配置项添加到该文件内。graphexp_params.py 文件的 graphexp_pid_dir 写法修改为:
1 | # graphexp的nginx pid文件路径 |
小结:在 status() 方法内,获取 graphexp-env.xml 文件内的配置,只有 xxx-env.xml 的内容才可以被 status() 方法加载到。
3、status()方法调试建议
由于 status() 是轮询调用,虽然目前还不知道日志输出的具体位置(没有输出到 ambari-agent.log 里面),但我也有自己的土办法:
1)以我写的 JanusGraph 服务为例,可以用 Execute(“echo {0} >> /tmp/graphexp.log”.format(graphexp_params.graphexp_pid_dir)) 命令来输出需要的参数值。
2)也可以根据上述 Execute 语句位置来判断代码具体的报错行数(Execute 语句执行情况,可以在 ambari 操作服务的弹窗上看到详情),方便定位代码报错地点。
点关注,不迷路
好了各位,以上就是这篇文章的全部内容了,能看到这里的人呀,都是人才。
白嫖不好,创作不易。各位的支持和认可,就是我创作的最大动力,我们下篇文章见!
如果本篇博客有任何错误,请批评指教,不胜感激 !


原文作者: create17
原文链接: https://841809077.github.io/2019/08/21/Ambari/自定义服务/ambari-custom-service-status.html
版权声明: 转载请注明出处(码字不易,请保留作者署名及链接,谢谢配合!)

