Prometheus Operator介绍
参考资料:
- https://yunlzheng.gitbook.io/prometheus-book/part-iii-prometheus-shi-zhan/operator/use-operator-manage-monitor
- https://www.qikqiak.com/k8s-book/docs/60.Prometheus%20Operator%E9%AB%98%E7%BA%A7%E9%85%8D%E7%BD%AE.html
一、Prometheus Operator能做什么
要了解Prometheus Operator能做什么,其实就是要了解Prometheus Operator为我们提供了哪些自定义的Kubernetes资源,列出了Prometheus Operator目前提供的️4类资源:
- Prometheus:声明式创建和管理Prometheus Server实例;
- ServiceMonitor:负责声明式的管理监控配置;
- PrometheusRule:负责声明式的管理告警配置;
- Alertmanager:声明式的创建和管理Alertmanager实例。
简言之,Prometheus Operator能够帮助用户自动化的创建以及管理Prometheus Server以及其相应的配置。
prometheus-operator chart包地址:https://github.com/coreos/prometheus-operator.git
二、部署
1、部署prometheus-operator deploy
Prometheus Operator通过Deployment的形式进行部署,为了能够让Prometheus Operator能够监听和管理Kubernetes资源同时也创建了单独的ServiceAccount以及相关的授权动作。
1 | root@master-1:~# kubectl get pod -n monitoring |
上面的pod中,包含两个容器,prometheus-operator与kube-rbac-proxy(这个还不知道什么作用)。
2、部署Prometheus实例
当集群中已经安装Prometheus Operator之后,对于部署Prometheus Server实例就变成了声明一个Prometheus资源。
1 | apiVersion: monitoring.coreos.com/v1 |
此时,查看monitoring命名空间下的statefulsets资源,可以看到Prometheus Operator自动通过Statefulset创建的Prometheus实例:
1 | root@master-1:~# kubectl get statefulset -n monitoring |
3、使用ServiceMonitor管理监控配置
为了能够让Prometheus能够采集部署在Kubernetes下应用的监控数据,在原生的Prometheus配置方式中,我们在Prometheus配置文件中定义单独的Job,同时使用kubernetes_sd定义整个服务发现过程。而在Prometheus Operator中,则可以直接声明一个ServiceMonitor对象,通过ServiceMonitor来描述监控对象的信息。
serviceMonitor资源对象会通过namespaceSelector.matchNames来匹配要查找service的namespace,通过spec.selector.matchLabels标签来匹配service,同时在endpoints中指定port名称为web的端口。

所以我们需要预先创建好对应标签的service与endpoints。
1 | apiVersion: v1 |
上面的service和endpoint需要注意什么呢?
首先需要注意各自的metadata.labels,还要注意ports.name要与servicemonitor的保持一致。(经过验证,至少要保证:1、ServiceMonitor能通过标签关联Service;2、Service和Endpoints的名字要保持一致;3、ServiceMonitor通过endpoints.port的名字关联Service绑定的Endpoints的ports.name; )
这样的话,serviceMonitor才知道监控哪个服务,这个服务下有哪些ip:port。这样prometheus下面就有对应的Targets了。
4、使用Operator管理AlertManager实例
Prometheus Operator通过Statefulset的方式创建的Alertmanager实例。
1 | apiVersion: monitoring.coreos.com/v1 |
AlertManager的配置是留存到Secret里面的,如果要修改Secret就涉及到了Secret加密解密的操作。以下为Secret解密的命令:
1 | 生成文件内容的base64编码后的内容: |
可以通过这条命令来看Secret解密后的数据:
1 | kubectl get secret -n monitoring alertmanager-main -o json | jq -r '.data."alertmanager.yaml"' | base64 --decode |
AlertManager部署成功后,需要修改Prometheus实例,确保Prometheus与AlertManager绑定。
1 | alerting: |
5、使用PrometheusRule定义告警规则
对于Prometheus而言,在原生的管理方式上,我们需要手动创建Prometheus的告警文件,并且通过在Prometheus配置中声明式的加载。而在Prometheus Operator模式中,则可以直接声明一个PrometheusRule对象来实现创建告警规则。
1 | root@master-1:~# kubectl get prometheusrule -n monitoring |
PrometheusRule对象示例:
1 | apiVersion: monitoring.coreos.com/v1 |
告警规则创建成功后,需要在Prometheus中使用ruleSelector通过选择需要关联的PrometheusRule。
1 | ruleSelector: |
这样,会自动在Prometheus Pod的/etc/prometheus/rules/prometheus-k8s-rulefiles-0/目录下生成一个对应的<namespace>-<name>.yaml文件,如下图所示:
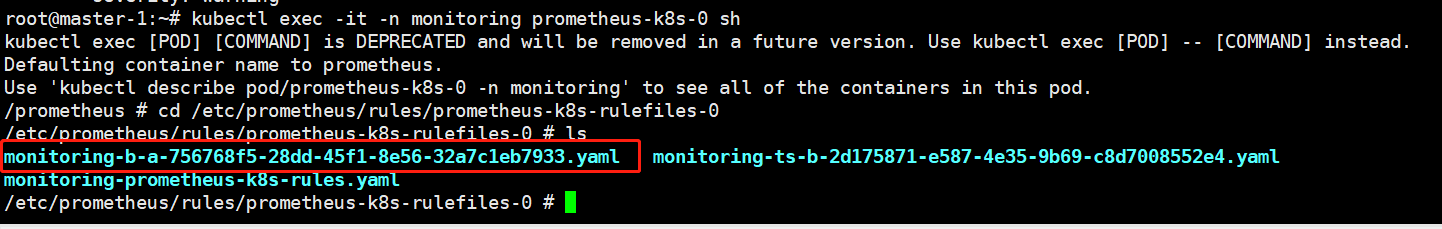
然后再去 Prometheus Dashboard 的 Alert 页面下面就可以查看到上面我们新建的报警规则了。这样如果以后我们需要自定义一个报警选项的话,只需要定义一个 PrometheusRule 资源对象即可。
6、疑问
1)Prometheus配置文件中的rule_files在哪指定的?
1 | rule_files: |
解答:
2)PrometheusRule对象创建后,yaml文件如何到的/etc/prometheus/rules/prometheus-k8s-rulefiles-0目录下的??
解答:prometheus operator框架规定的。
我们创建一个 PrometheusRule 资源对象后,会自动在上面的 prometheus-k8s-rulefiles-0 目录下面生成一个对应的<namespace>-<name>.yaml文件,所以如果以后我们需要自定义一个报警选项的话,只需要定义一个 PrometheusRule 资源对象即可。至于为什么 Prometheus 能够识别这个 PrometheusRule 资源对象呢?这就需要查看我们创建的 prometheus 这个资源对象了,里面有非常重要的一个属性 ruleSelector,用来匹配 rule 规则的过滤器,要求匹配具有 prometheus=k8s 和 role=alert-rules 标签的 PrometheusRule 资源对象,现在明白了吧?
1 | ruleSelector: |
3)AlertManager对象创建后,创建的Secret如何与alertmanager.yaml文件相关联?
解答:
4)serviceMonitor里面的metadata.labels有什么作用?
暂时没什么作用
5)Prometheus的Target中的job标签在哪定义的?
Prometheus的每个Target都对应着一个ServiceMonitor,在ServiceMonitor中有jobLabel标签。具体可参考:https://cloud.tencent.com/document/product/1416/55995#service-monitor
6)ServiceMonitor中的targetLabels有什么作用?
把对应 service 上的 Label 添加到 Target 的 Label 中
7)kube-system的kubelet是谁创建的?
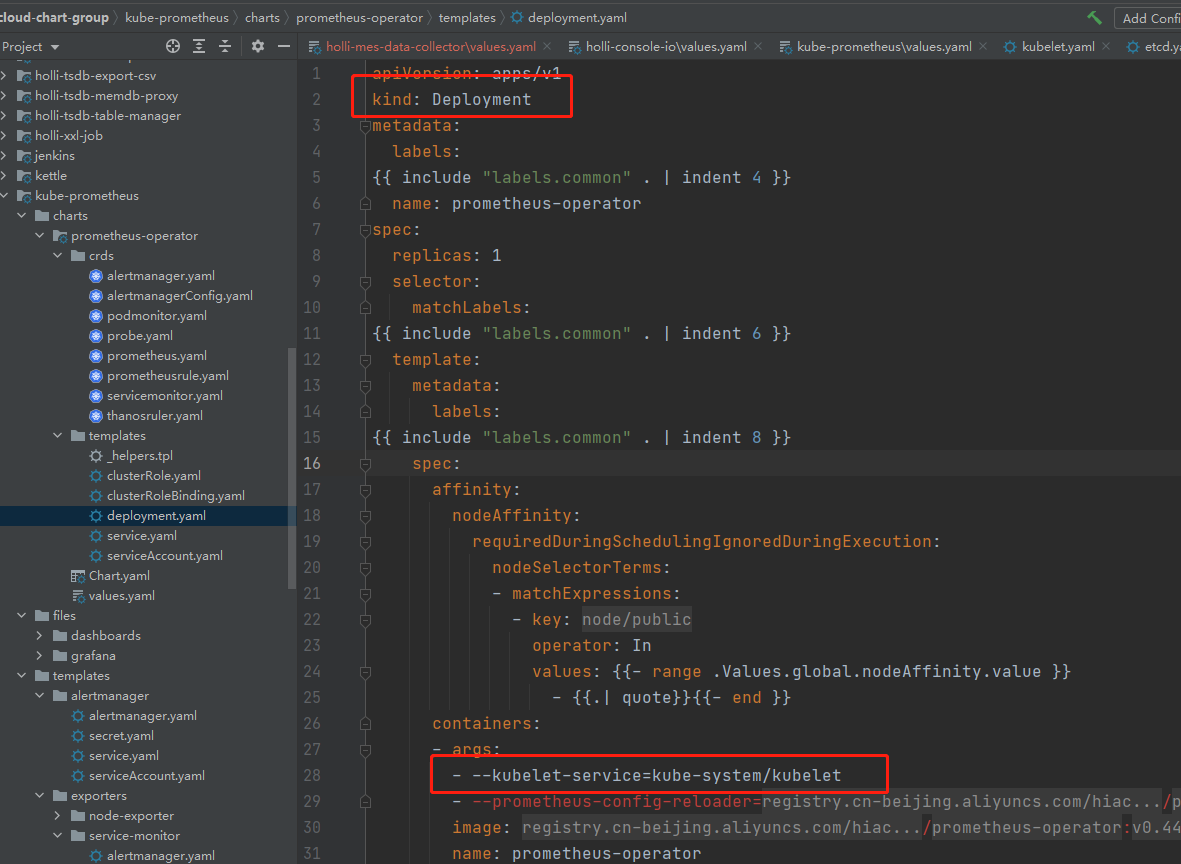
prometheus-operator 的 deploy,启动时有个参数:–kubelet-service=kube-system/kubelet,应该是在这里指定创建kubelet。可以指定创建的namespace和svc、ep的名称。参考地址:https://github.com/prometheus-operator/prometheus-operator/issues/4938
点关注,不迷路
好了各位,以上就是这篇文章的全部内容了,能看到这里的人呀,都是人才。
白嫖不好,创作不易。各位的支持和认可,就是我创作的最大动力,我们下篇文章见!
如果本篇博客有任何错误,请批评指教,不胜感激 !


原文作者: create17
原文链接: https://841809077.github.io/2022/03/08/Prometheus/prometheus-operator/introduce.html
版权声明: 转载请注明出处(码字不易,请保留作者署名及链接,谢谢配合!)

